
MACD + RSI + VWAP: How the popular combo stacks up against buy-and-hold
MACD, RSI and VWAP are three of the most popular indicators traders stack together. We wanted a simple answer: does combining them actually beat just buying and holding?
Short answer: no. Over 15 years it trailed holding on every symbol we tested. Its one real win was protecting capital in the 2022 bear market.
How we tested it
Buy when all three agree:
- MACD (a trend gauge) is above its signal line
- RSI(14) (a momentum gauge) is above 50
- The close is above the 20-day VWAP (average price weighted by volume)
Sell when MACD drops below its signal or the close drops below VWAP. Long only, no shorting.
We used daily bars from October 2011 to October 2026 on SPY, QQQ and the Magnificent 7. Trades fill on the next bar with 0.05% cost per side. GOOGL's data starts in April 2014 and META's at its May 2012 IPO, so both have shorter windows.
What we found
1. It lost to holding on all nine symbols. SPY made 4.6% a year versus 14.3% for holding, so $1 grew to $1.96 instead of $7.40. QQQ made 8.6% versus 19.2%.
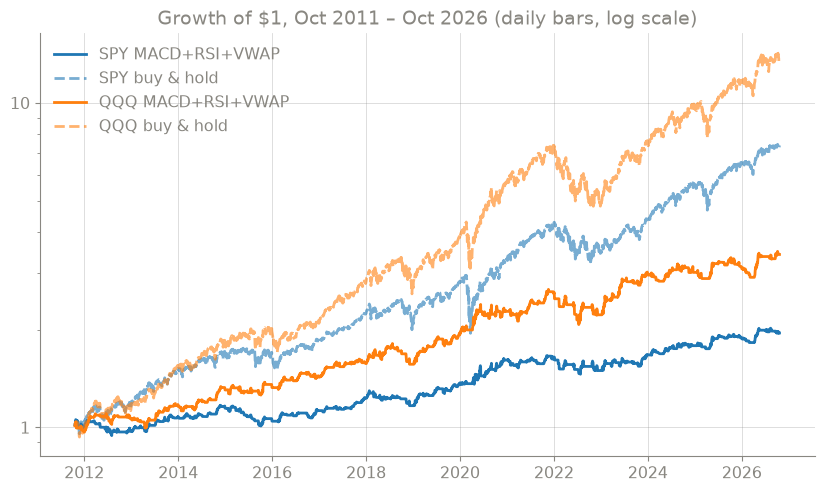
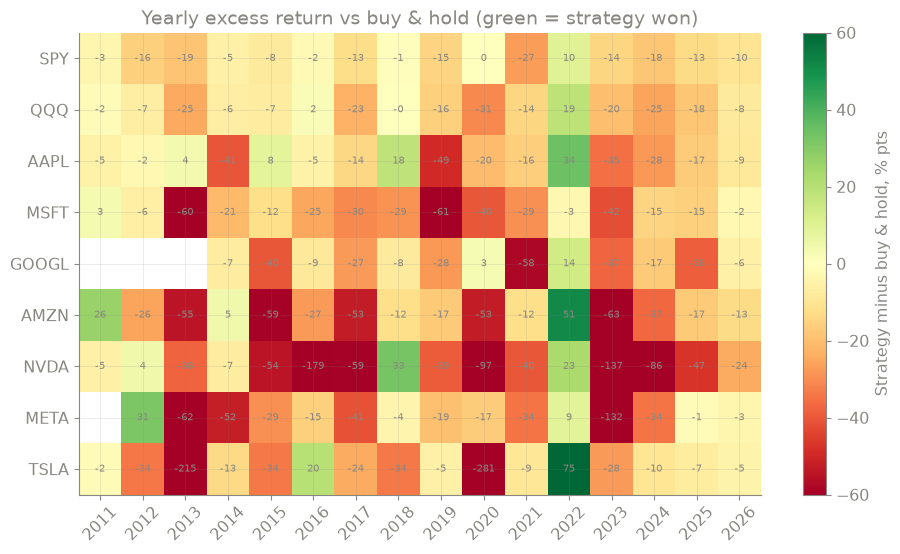
2. Big tech showed the same gap. NVDA (19% a year vs 54%) and TSLA (29% vs 43%) did best but still trailed. MSFT lost money at −1.6% a year, and META made only 3%.
3. Smaller drops, but mostly from sitting in cash. The worst drawdown was smaller on 8 of 9 symbols, largely because the strategy was out of the market about 45% of the time. Only AAPL beat holding on risk-adjusted return (Sharpe 1.00 vs 0.92).
4. Most trades lost. Only 33% to 44% of trades made money, so results hinged on a few long trends.
5. There was no golden era. The rule never "worked and then stopped."
- 2011–2021: At most 2 of 9 symbols beat holding in any year. It fell furthest behind in strong bull years like 2013, 2017 and 2020.
- 2018 drawdown: No help. Only 2 of 9 came out ahead.
- 2022 bear market: The one clear win. Median loss was 14% versus 39% for holding, and 8 of 9 symbols beat holding.
- 2023–2026: The worst stretch. 0 of 9 beat holding, trailing by a median 8 to 37 points a year.
The bottom line
Stacking three popular indicators did not create an edge. In rising markets, the extra filters kept the strategy out of the best moves, and the gap grew wider after 2022. What it really offered was a cash cushion during long, steady declines like 2022.
If that protection is what you want, a natural next test is adding a 200-day moving-average filter, so the rule only trades with the long-term trend. That would show whether the 2022 cushion can survive without giving up so much in bull markets.
Sigmo can make mistakes — verify important info. Not financial advice.
Get AlphaWeekly in your inbox
Free. New issues as they are published, with the charts and the method in view.