
How QQQ Trades Around the Midterms
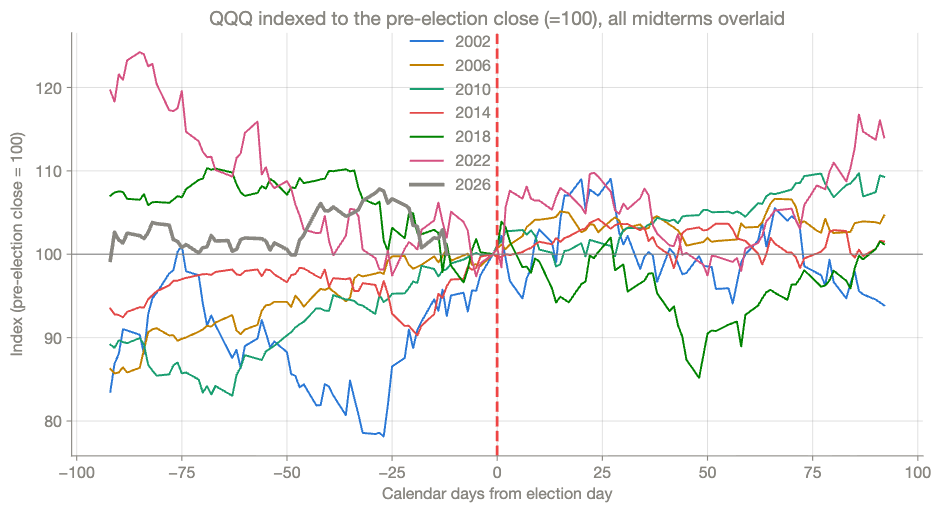
The short version: in five of the last six midterm cycles, QQQ was higher three months after election day. The weak stretch tends to come before the vote, not after it.
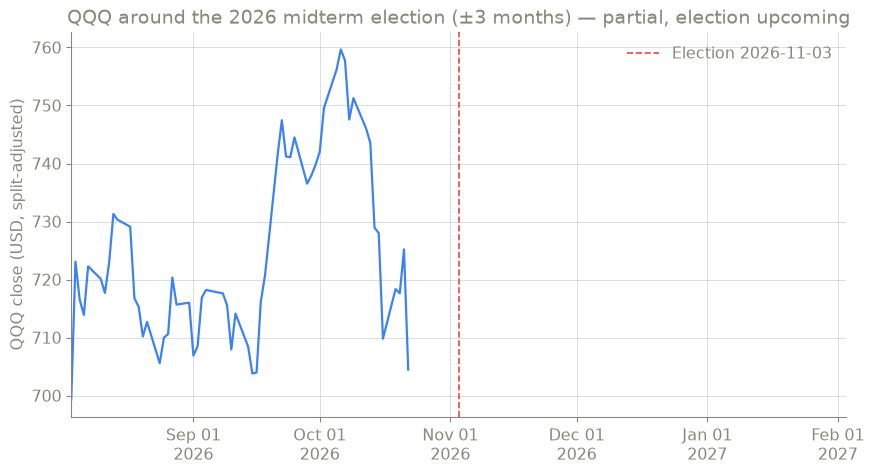
QQQ data starts in March 1999, which gives us six complete midterm cycles (2002–2022). For each one we looked at the window from three months before to three months after election day. 2026 is still in progress.
By the numbers
| Midterm | 3 months before | 3 months after | Biggest drop in window |
|---|---|---|---|
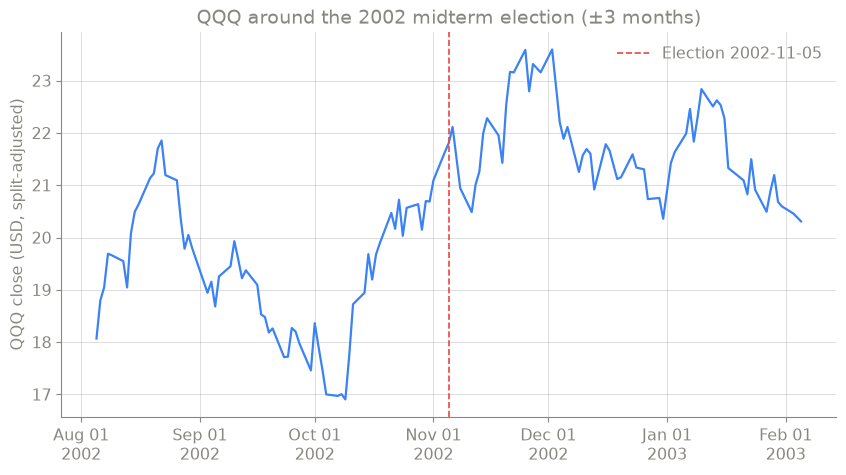
| 2002 | +19.8% | −6.1% | −22.7% |
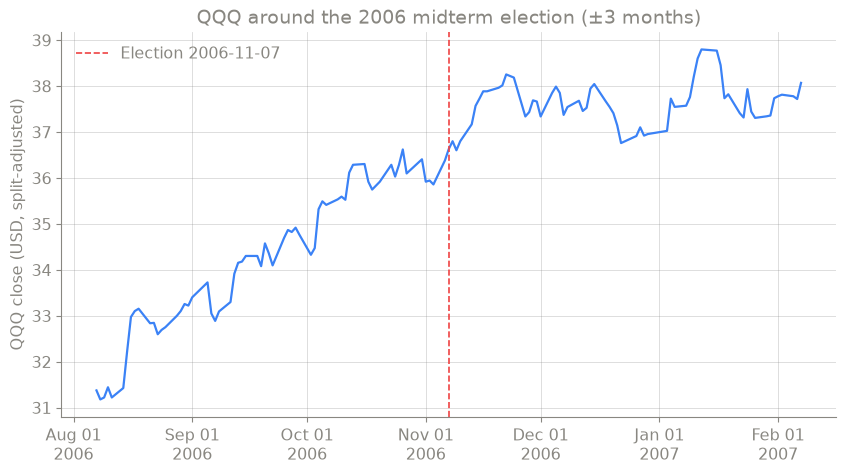
| 2006 | +15.9% | +4.6% | −3.9% |
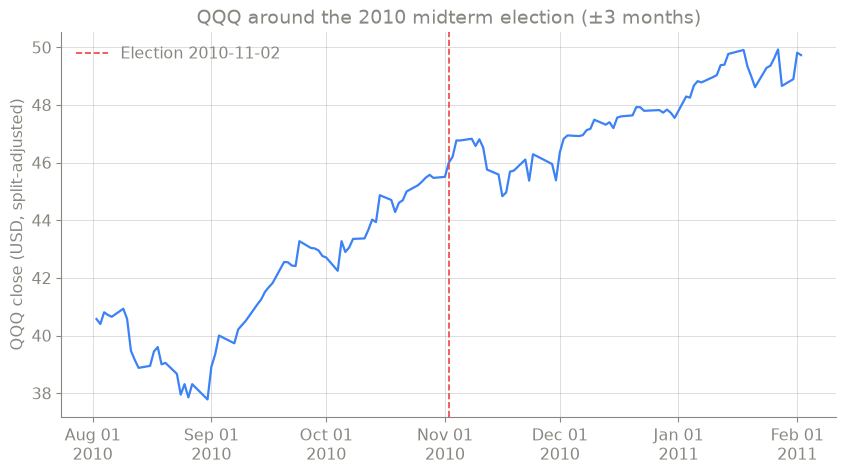
| 2010 | +12.2% | +9.3% | −7.7% |
| 2014 | +6.9% | +1.5% | −8.3% |
| 2018 | −6.6% | +1.2% | −22.8% |
| 2022 | −16.4% | +14.0% | −21.7% |
- Win rate: 5 of 6 cycles finished higher three months after the vote.
- Average gain: about +4%. The median was about +3%.
- Range: from −6.1% (2002) to +14.0% (2022).
All six cycles on one chart
What stands out
- Weakness before the vote often set up gains after it. In 2022 QQQ hit its low on Nov 3, just days before the election. In 2002 the low came about four weeks before. Both times QQQ was higher three months after the vote.
- The one loss had a bigger story. 2002 is the only cycle that ended lower. That was the tail end of the dot-com bear market, so the election was hardly the main driver.
- Drawdowns are common. Three of the six windows included a drop of more than 20%. The pattern has held on average, but the path has rarely been smooth.
Cycle by cycle
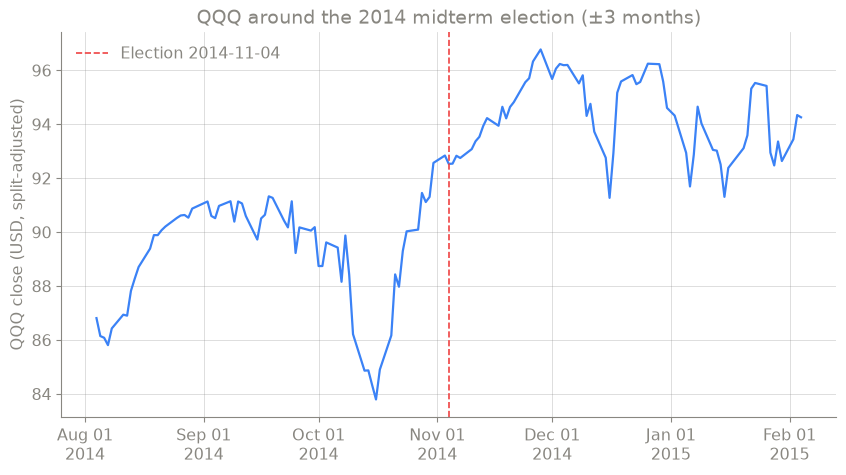
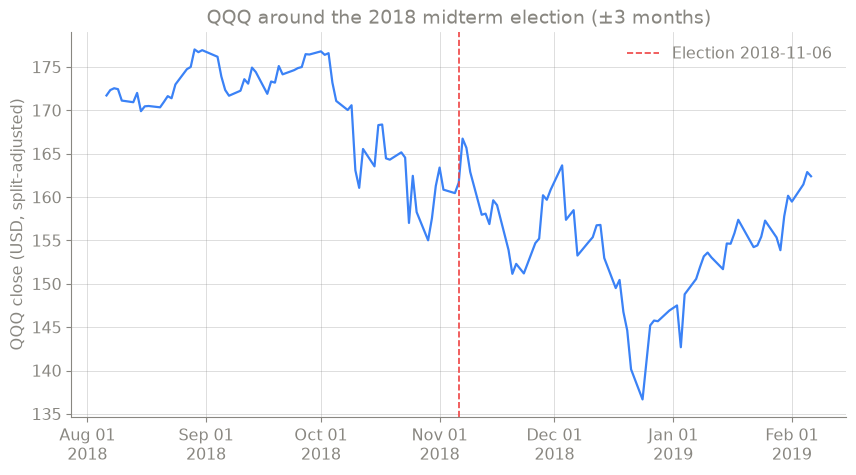
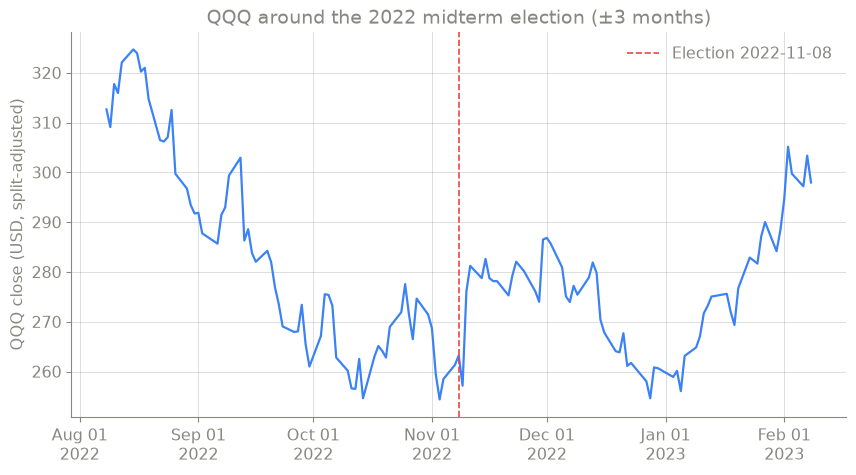
Where 2026 stands
Sigmo can make mistakes — verify important info. Not financial advice.
Get AlphaWeekly in your inbox
Free. New issues as they are published, with the charts and the method in view.